When you build an A/D converter into a circuit, as part of a system, the first thing to do is to measure its performance. The reason is that A/D converters are very layout and bypass sensitive; the A/D specifications provided by the manufacturer were measured using an idealized test fixture; probably your implementation isn’t quite so ideal, and requires a little refinement. Therefore, for any new A/D circuit design you will always need to measure the performance of your A/D to assure yourself that its performance in your circuit at least nears the part’s rated specifications.
More than likely, your first design will need refinement, and you will end up repeatedly measuring and improving the performance of the A/D converter in your circuit and system. With hard work and persistence, you will eventually measure something close to the manufacturer’s A/D specifications.
The following uses ScopeDSP™ to analyze a data sample taken from a high-performance 14-bit, 10 MHz A/D converter made by a leading vendor of digital and analog devices. The performance of this part (really a chip set) is so high that achieving the part’s specified performance in an actual application circuit (not just a test fixture) was a major challenge. In fact, just testing the part is a major challenge because it is extremely difficult to generate analog signals which have less distortion than this A/D converter produces. The captured signal we will analyze is the end product of literally months of iteration to achieve the converter’s specified performance in its application circuit. For those of you who’d like to play along at home, the A/D signal we will analyze is captured in the file twomhz.bin. This is binary file whose data samples are in IEEE 32-bit format (corresponding to ScopeDSP’s “Binary:float” data file format). It contains 8192 real points of a 1.953125 MHz sine signal which was sampled at a 5.0 MHz rate.
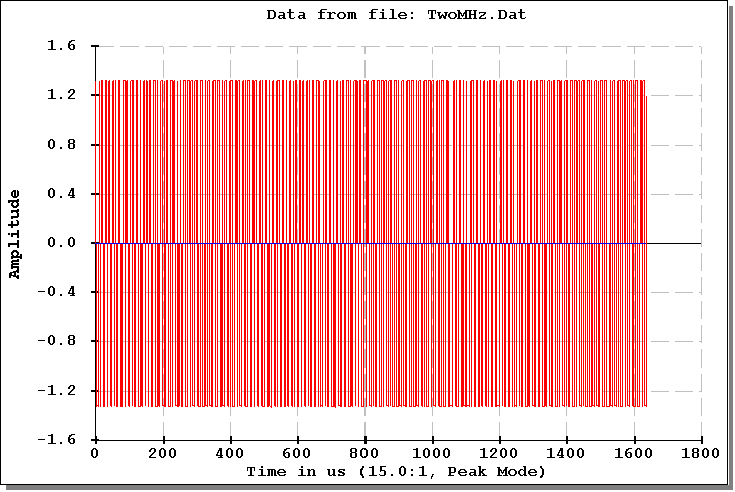
Below is a plot of the entire signal:

This picture isn’t much to look at because the sine is at a high frequency relative to the sampling rate and because the sample size is large compared to the number of horizontal pixels. Let’s zoom in:
This plot is a little more meaningful, but still doesn’t look much like a sine wave except to the most highly trained eye.
