ScopeIIR™ provides sophisticated Pole-Zero Plots as part of its IIR filter design and analysis capability.
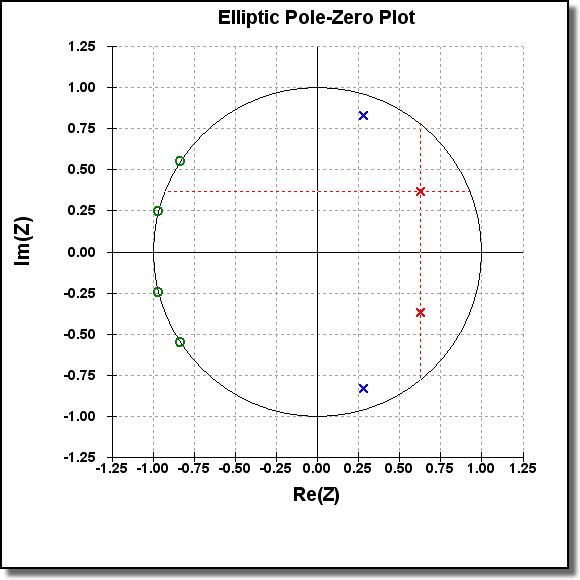
Its Pole-Zero Plot shows the Z-domain poles and zeros of the filter’s transfer function. Poles are indicated by “X” and zeros are indicated by “O”. The Z-plane is represented with real values along the horizontal axis and imaginary values along the vertical axis. The “unit circle” is drawn as a circle of magnitude 1.0. An example is shown below:
Besides giving you insight into the filter’s stability, the Pole-Zero Plot allows you to adjust the filter’s frequency response by altering the locations of the poles and/or zeros, which we’ll refer to collectively as “roots”. To do that, first select a root by clicking directly on its symbol, or by pressing “Ctrl-Shift” and clicking near its symbol. Then, the symbol will turn red and a cursor will appear, as shown below:

The selected root can be moved either by dragging it with the mouse or by using the arrow keys on the keyboard. If a root is part of a conjugate pair, the conjugate will move in coordination with the selected root: the conjugate root is always located at the same distance along the real axis as the selected root, and at the same distance above/below the Imaginary axis as the selected root is below/above.
Polar Mode
The cursor shown above is for polar mode, which is the default. The polar cursor consists of a red circle drawn through the selected root and its conjugate, and a red line drawn through the root from the origin to the unit circle.
In polar mode, the left/right arrow keys change the root’s phase, and the up/down arrow keys change it’s magnitude. The root’s phase is related to its frequency, where zero radians corresponds to zero frequency, and pi radians corresponds to Fs/2. Therefore, pi/2 radians corresponds to Fs/4.
Cartesian Mode
Cartesian mode allows you move the selected root in terms of real and imaginary components rather than phase and magnitude. You can toggle between polar and Cartesian mode at any time via the “m” key, or by clicking on “Polar Mode” on the Pole-Zero menu or the pole-zero plot’s right-click menu.
A plot in Cartesian mode is shown below:

The Cartesian cursor consists of red horizontal/vertical lines rather than the circle/line of polar mode. The vertical line goes through both the selected root and its conjugate.
Zooming
On the Pole-Zero Plot, zooming is done in the usual way via the mouse, except that zooming must start at some point away from any root to allow it to be distinguished from root selection/movement. However, by pressing “Ctrl” prior to the mouse operation, you can force zooming to take place at any point, regardless of any nearby roots.
The mouse and arrow key movement increments are proportional to the resolution of the current zoom level, so to make fine adjustments using the arrow keys, you should zoom in near the selected root. The closer you zoom in, the finer the key movement resolution becomes.
Constraints
By default, pole and zero movements are constrained to be within the unit circle. However, you can remove these constraints by selecting Constrain Poles or Constrain Zeros on the Pole-Zero menu or on the Pole-Zero plot’s right-click menu. When poles are not constrained, the unit circle is drawn with a dotted line, indicating that poles can be moved through it.
Although there might be reasons to place zeros outside the unit circle, placing poles outside the unit circle will result in an unstable filter – as you will see on your filter’s Impulse Response and Step Response plots! So, the constraint on poles should only be removed to allow you to demonstrate instability by placing poles outside the unit circle: there is no reason to remove it when actually designing a filter.
